Agenda
Signal Processing Seminar
- Thursday, 10 October 2019
- 13:30-14:30
- HB 17.150
Analytical Full-Wave Free Induction Decay Signal Model for MRI
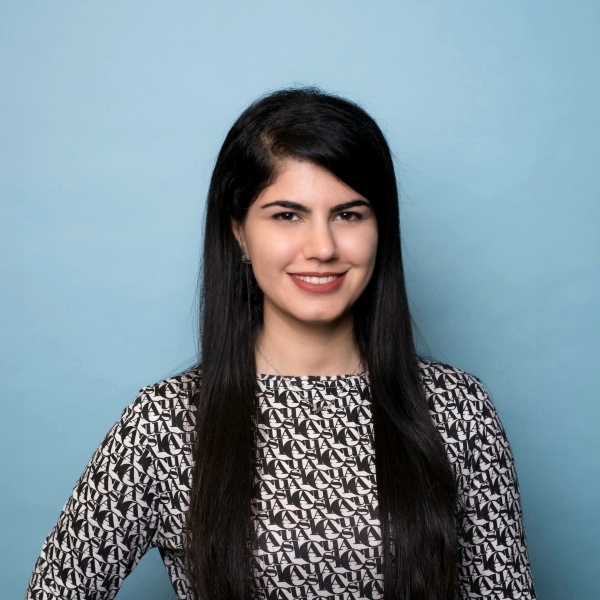
Patrick Fuchs
The derivation of the standard signal model in Magnetic Resonance Imaging (MRI) is based on a quasi-static electromagnetic field approximation and is essentially obtained through an application of the Biot-Savart law. Such an approach works fine for relatively low MR background fields (up till 1.5 T, say), but the model may lose its validity at higher static background fields, since the oscillation frequency of the electromagnetic radio-frequency fields is linearly related to the magnitude of this background field via the well-known Larmor equation. Consequently, an increase in the strength of the static background field leads to an increased Larmor frequency and the quasi-static field approximation may no longer be applicable.
In this presentation, We derive a signal model based on the full Maxwell system and no quasi-static field approximations are applied. We show that the measured signal consists of a direct term that relates the measured signal to the time-varying magnetization within the sample and a scattering term that is due to the dielectric contrast of the sample with respect to its surroundings (assuming no contrast in the permeability). Similar to the quasi-static case, the contribution of each term to the measured signal can be expressed in terms of so-called electric and magnetic receive fields, which basically act as frequency-dependent sensitivity functions. Furthermore, the scattering term is expressed in terms of the electric field strength inside the sample but this field is unknown in general. However, if the dielectric constitution of the sample is known then this field can be determined in principle. Additionally, for low-contrast samples, the Born approximation may be applied leading to an explicit analytic full-wave signal model in terms of the magnetization of the sample, its conductivity, and its permittivity. Finally, through simulations, we illustrate the receive field sensitivity functions for different measurement scenarios and show which terms in the signal model provide the largest contribution to the measured signal as a function of receiver location, frequency, and dielectric composition and size of the sample under test.
Additional information ...
Agenda
- Tue, 30 Apr 2024
- 10:00
- HB18.090
MSc SPS Thesis presentation
Wim Kok
A SystemC SNN model for power trace generation
- Mon, 6 May 2024
- 12:30
- Aula Senaatszaal
PhD Thesis Defence

Christoph Manss
Multi-agent exploration under sparsity constraints
- Tue, 21 May 2024
- 10:00
- Aula Senaatszaal
PhD Thesis Defence

Wangyang Yu
- 27 -- 28 May 2024
- Aula, TU Delft
Conferences

44th Benelux Symposium on Information Theory and Signal Processing (SITB'24, Delft)
- Tue, 18 Jun 2024
- 15:00
- Aula Senaatszaal
PhD Thesis Defence

Hanie Moghaddasi
Model-based feature engineering of atrial fibrillation
- Mon, 24 Jun 2024
- Aula, TU Delft
Conferences
